


HCPSS MSDE Dashboard (2016–2024): Visualizing Equity, Achievement, and Investment in Our Schools
A data-driven tool to explore demographics, academic achievement, and per-student funding across HCPSS schools

Introduction
The HCPSS MSDE dashboard is a tool that provides student demographic, performance, per-pupil spending and class size data. The information is compiled from the Maryland State Department of Education School Report Card website as well as the annual class size reports provided to the Board of Education.
The Maryland State Department of Education (MSDE) is a public education agency responsible for overseeing the state's public schools. Every year, the MSDE releases a report card for each public school in the state. The report card includes demographic data for each school.
For each school, the report also includes various achievement and proficiency metrics. Additionally, the report card includes per-student expenditure data. The dashboard allows the user to view the data in a user-friendly format. It allows the user to view student report cards and demographic data for different years and schools.
The Board of Education receives annual class size reports for each school year. The dashboard compiles these reports across all school levels.
Demographic Information
The Demographic Data section enables the user to get a snapshot of a school. The MSDE report card provides student demographic data for the years 2020 through 2024. Demographic data includes race, economic, and student population categories such as the number of students with disabilities. The section also provides per-student expenditure for the given school for 2019 through 2023.

Overall Performance and Proficiency Indicators
This section also provides school-specific information. The MSDE report card provides performance indicators for each school. These indicators are Academic Achievement, Academic Progress, School Quality and Student Success, and Progress in Achieving English Language Proficiency for all school levels. For high schools, the MSDE report card removes Academic Progress and adds Graduation Rate and Readiness for Post-Secondary Success. The user is able to view trends of the scores over the reported period for each indicator. These parameters are defined by the MSDE and are used to evaluate the performance of each school.


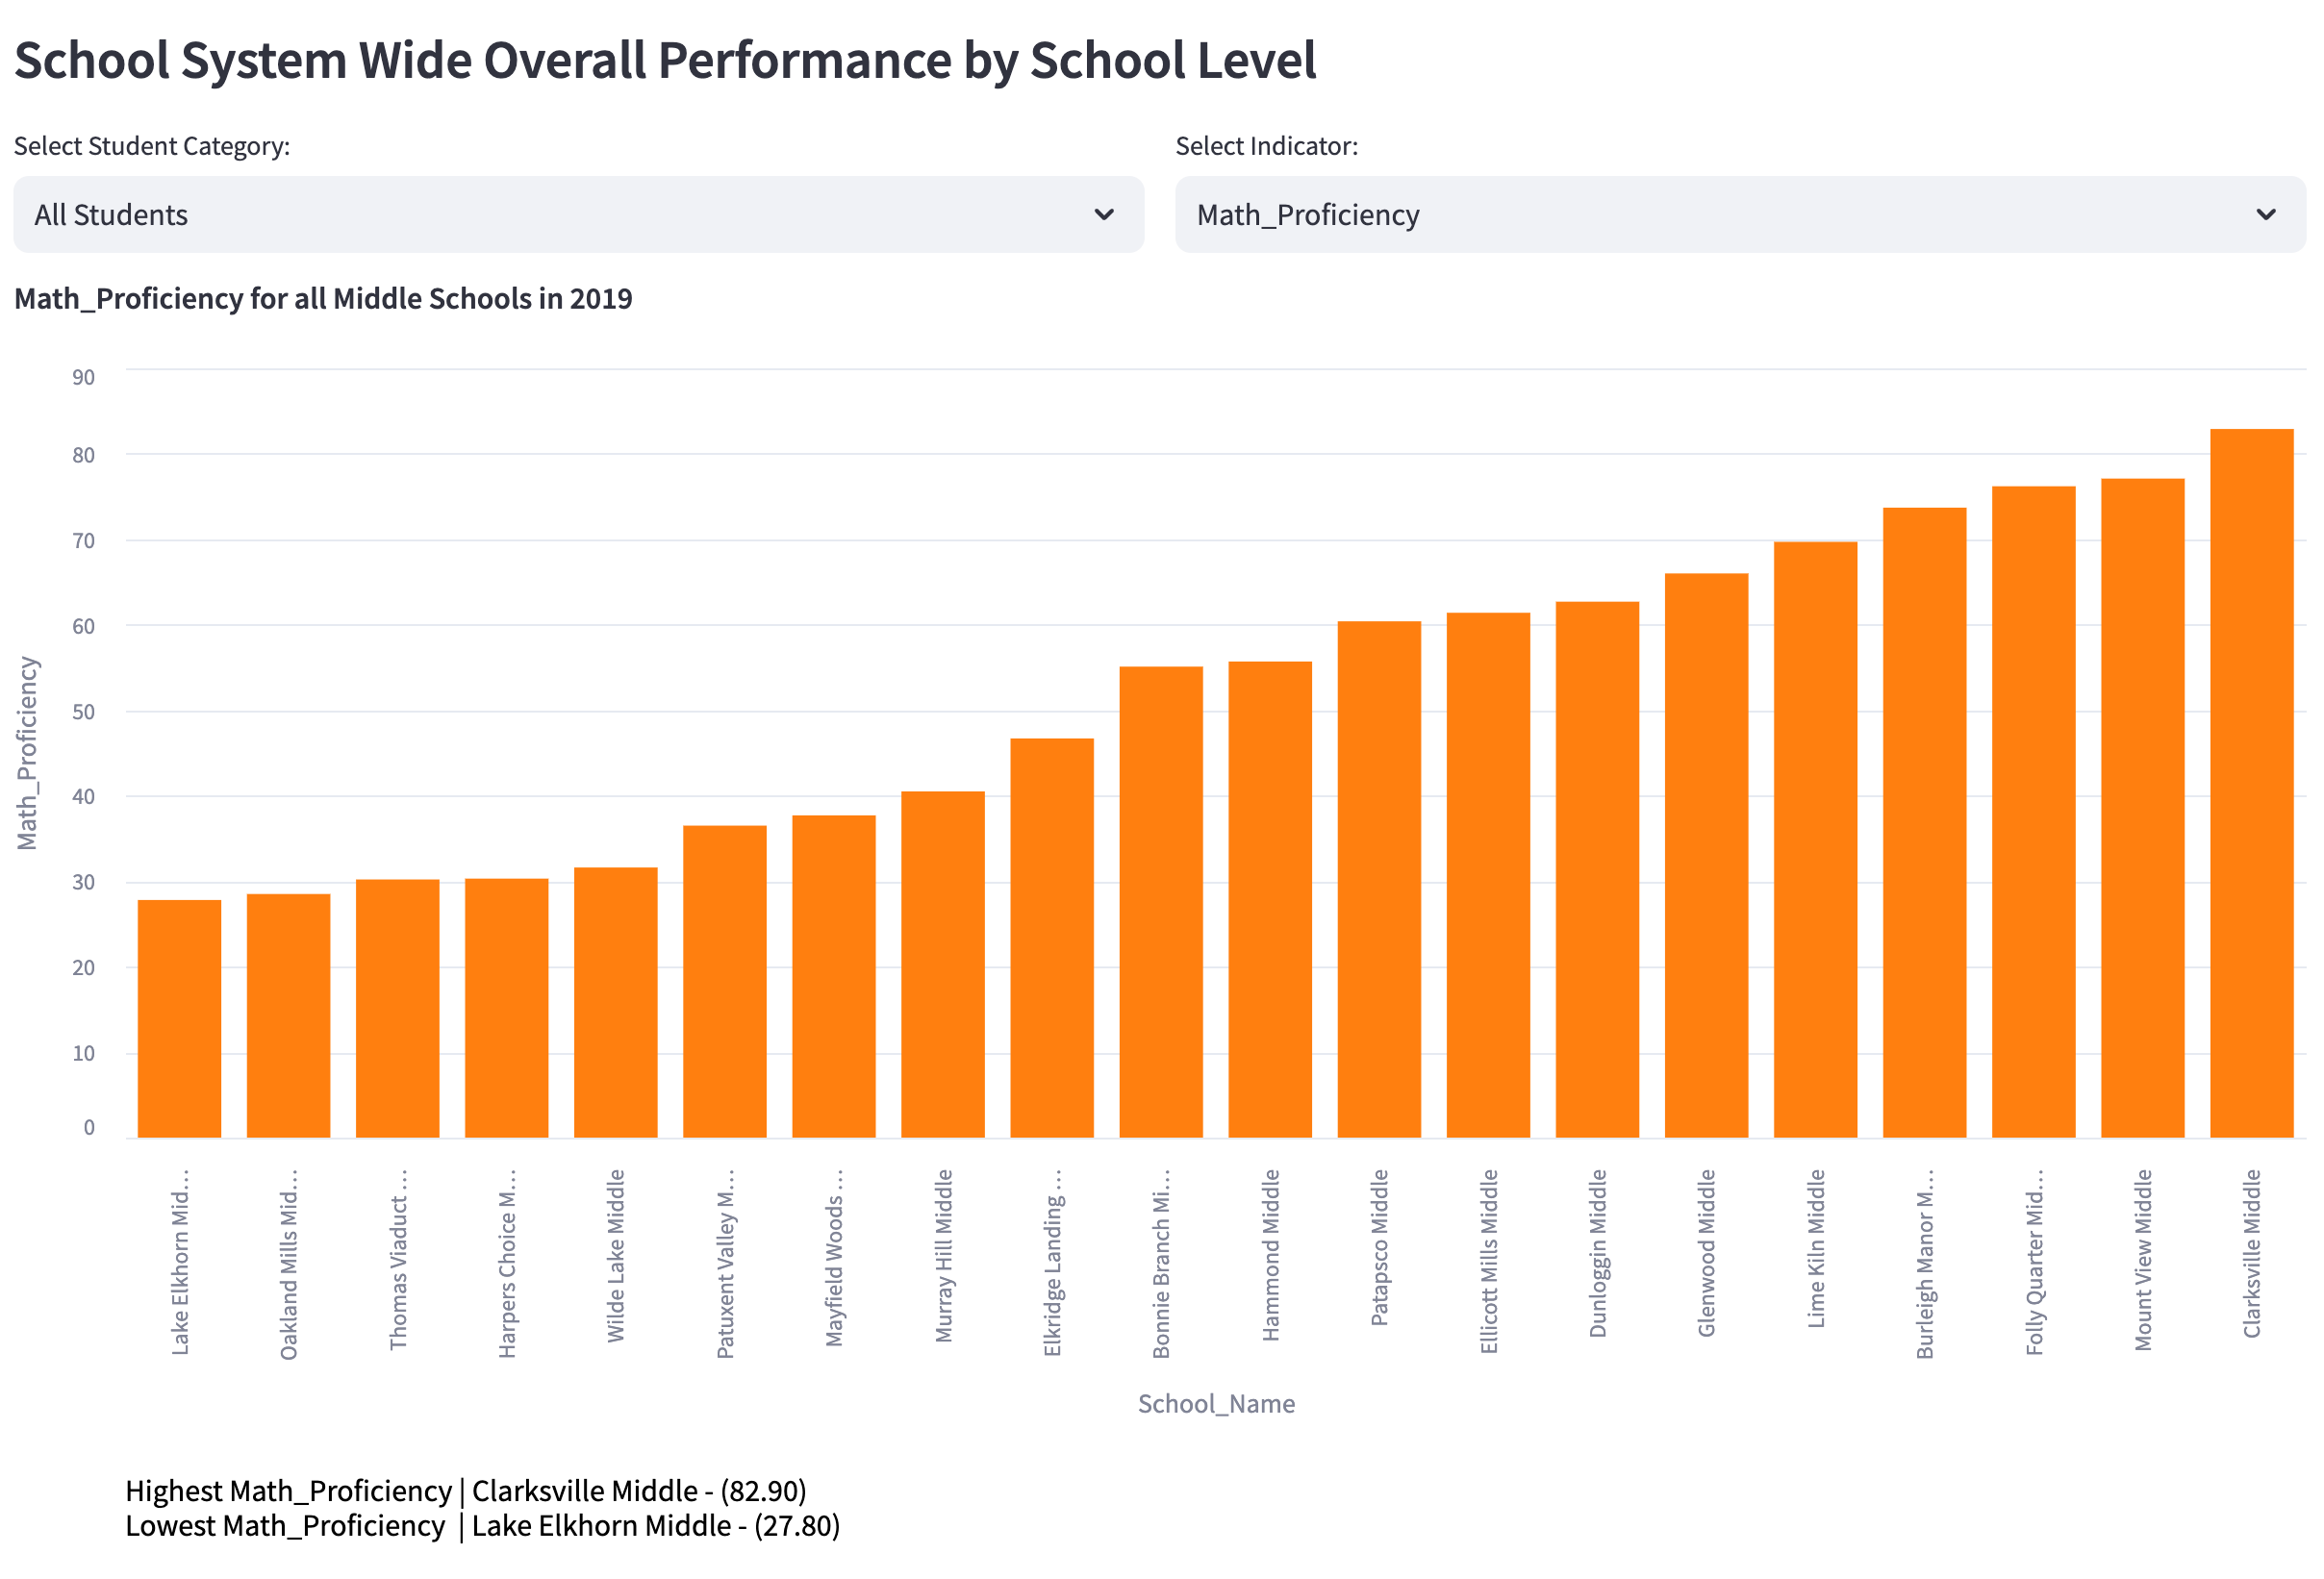
Comparison of School System-Wide Performance by School Level
The next section allows the user to compare the overall performance of all schools within a given level for a given year. The figure below compares total points earned by elementary schools, highlighting both the lowest and highest scores. The user can select the year, school level, and performance indicator to get a snapshot. Comparisons of Math and English Language Arts (ELA) proficiency are displayed in the same section, showing the lowest and highest scores.

Local, State, and Federal Per-Student Expenditure
In this section, the user can compare per-student expenditures by school level and for years between 2019 and 2023. MSDE provides annual per-pupil expenditure for each school, categorized by federal and state/local funding. State and local spending are reported together. The user can also view trends in per-pupil expenditures over the reported period for each school.


Class Sizes
The final section allows the user to explore the class size changes from 2016 through 2024 for a given school. The dashboard provides average class size data for elementary schools and separate class sizes for Math and ELA at middle and high school levels. The user can also compare class sizes across schools by level and for a given year.


Parents, educators, and advocates are encouraged to explore the dashboard and share their observations, suggestions for improvements, and ideas for additional information that would enhance its usefulness.
Future reports will include deeper analysis of the data to identify trends and explore potential policy recommendations based on observed relationships.